How Many Losing Trades In A Row Is Normal?
Quick question. You’ve spent months testing a strategy. Hundreds of trades. The maths looks good. Then Monday happens. Loss. Another loss. Then another. By loss number four, your b…
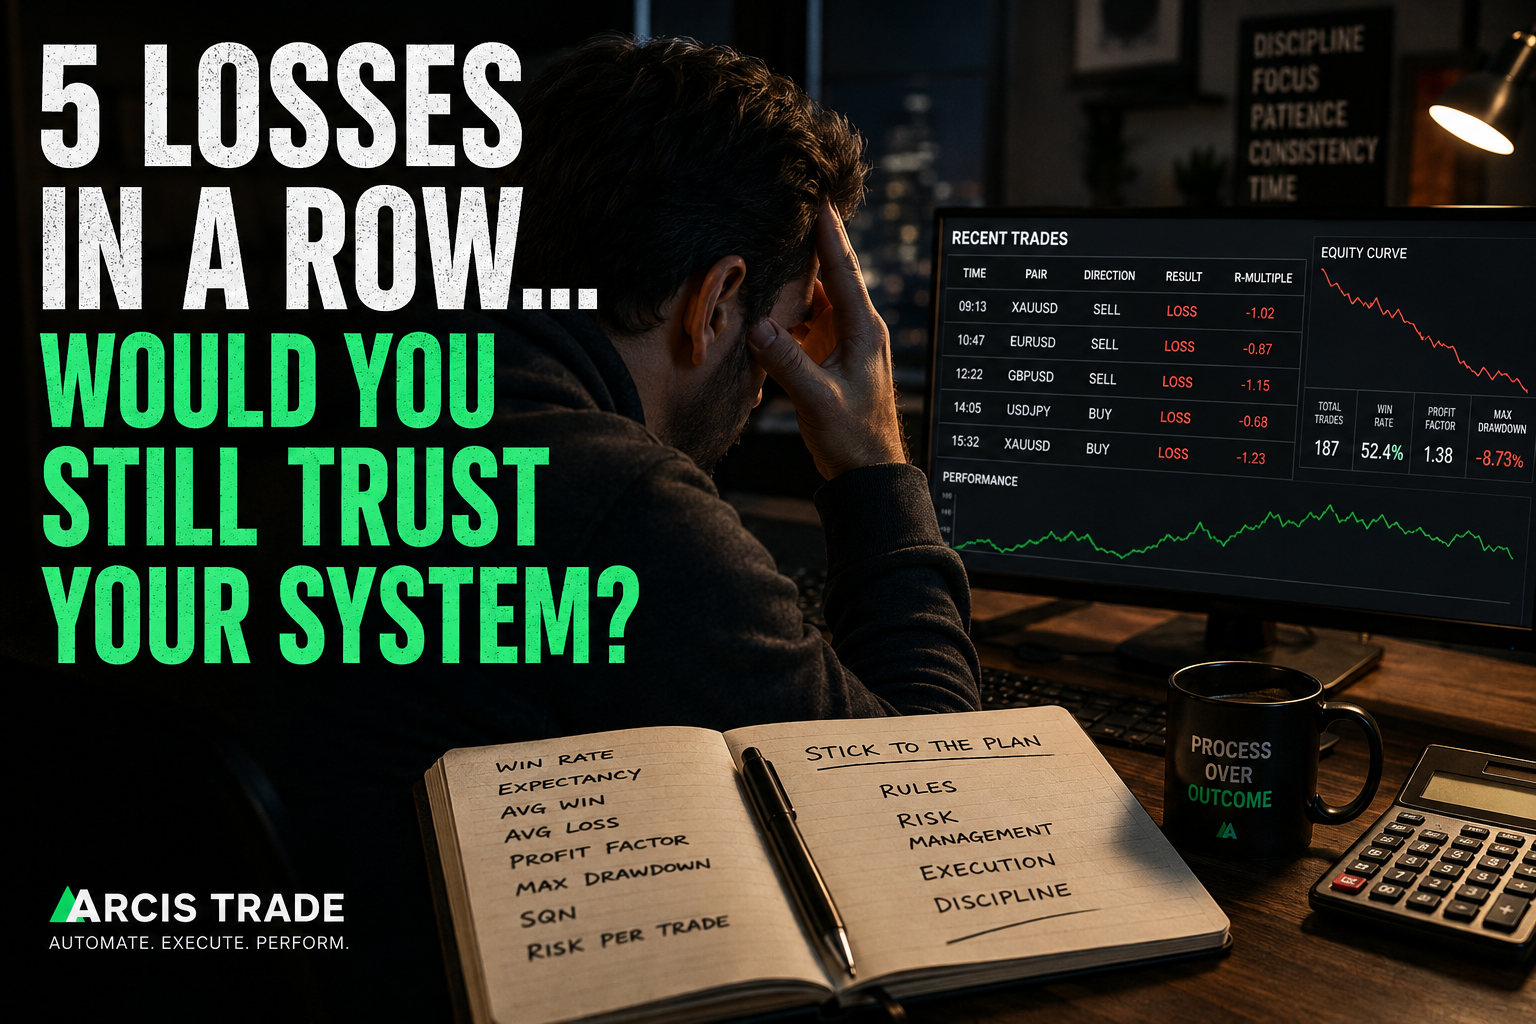
Quick question.
You’ve spent months testing a strategy.
Hundreds of trades.
The maths looks good.
Then Monday happens.
Loss.
Another loss.
Then another.
By loss number four, your brain has opened a full criminal investigation.
“Has the market changed?”
“Did the strategy stop working?”
“Should I change the settings?”
By loss number five, TradingView is open and some bloke on YouTube is explaining how his new indicator “never loses.”
Your strategy?
Apparently dead by lunchtime.
Here’s the funny bit.
It might be doing absolutely nothing wrong.
You might simply have no idea what a normal losing streak actually looks like.
And that is a much bigger problem.
How many losing trades in a row is normal?
There is no universal number.
A normal losing streak depends on:
- win rate
- sample size
- average win
- average loss
- expectancy
- trade distribution
- market regime
A system winning 70% of its trades can still lose several times in a row.
A system winning 50% can obviously do it more often.
The market doesn’t hand out results in a tidy pattern.
It can go:
Win.
Win.
Loss.
Loss.
Loss.
Loss.
Then five winners.
Probability can be a bit of a bastard like that.
And if you don’t know what the distribution should look like, every bad run feels like an emergency.
Does a losing streak mean your trading system is broken?
No.
A losing streak by itself does not prove a strategy has stopped working.
The better question is:
Is what I’m seeing still inside the range my testing said was possible?
That is the difference.
A system deserves investigation when live behaviour starts moving materially outside the boundaries established during testing.
For example:
- drawdown exceeds expected limits
- expectancy deteriorates
- Profit Factor collapses
- execution changes
- volatility regime changes
- live results diverge sharply from forward testing
Those are useful signals.
“I feel uncomfortable.”
Less useful.
Your trading system doesn’t know it has lost five trades
This is obvious.
But important.
Your system doesn’t wake up after five losses and think:
“Christ, we’d better win this one.”
You do.
Humans drag the last outcome into the next decision.
The system doesn’t.
If the sixth setup meets the same tested conditions, it is just another trade in the distribution.
It is not:
“The trade after five losses.”
You gave it that meaning.
The market didn’t.
This is where traders destroy perfectly good systems
You lose three trades.
Now you’re nervous.
So you skip trade four.
Trade four wins.
Naturally.
Now you’re annoyed because you skipped the winner.
So you definitely take trade five.
Trade five loses.
Now you’re angry.
So you increase size on trade six because you want to get back to breakeven.
Trade six loses too.
Beautiful.
You have now turned an ordinary losing streak into:
- missed winners
- oversized losers
- inconsistent risk
- revenge trading
- useless performance data
And then you say:
“The strategy stopped working.”
Maybe it didn’t.
Maybe you stopped trading the strategy.
What is trading expectancy?
Expectancy sounds more complicated than it is.
It answers one question:
If I keep taking this type of trade, what is each trade worth to me on average?
A simplified formula is:
Expectancy = (Win Rate × Average Win) − (Loss Rate × Average Loss)
Example:
Win rate: 50%
Average winner: +2R
Average loser: -1R
So:
50% × 2R = 1R
50% × 1R = 0.5R
Expectancy:
+0.5R per trade
That does not mean every trade makes 0.5R.
You might get:
-1R
-1R
+2R
-1R
+2R
+2R
Messy.
But over enough trades, the positive expectancy has a chance to express itself.
This is where retail trading gets funny.
Trader A:
“It only wins half the time.”
Trader B:
“What’s the expectancy?”
Trader A:
“The what?”
And there you have half the industry.
Van Tharp understood the part traders ignore
Van Tharp spent decades trying to get traders to stop treating the entry as though it were the whole game.
It isn’t.
The real pieces are:
- expectancy
- R-multiples
- position sizing
- drawdown
- sample size
- system quality
- execution consistency
Because two traders can take the same strategy and get very different results.
Trader A risks 0.5%.
Trader B gets excited after four winners and jumps to 3%.
Then the losing streak arrives.
Trader A:
“Rough week.”
Trader B:
“My broker is manipulating my account.”
Same strategy.
Different sizing.
Completely different outcome.
What is SQN in trading?
SQN means System Quality Number.
Van Tharp developed it as one way to evaluate a trading system.
At a high level, SQN looks at:
- average R-multiple
- variability of results
- sample size
The point is not that SQN is magic.
It isn’t.
The point is that serious system evaluation looks beyond:
“What’s the win rate?”
You should care about:
- Profit Factor
- expectancy
- Sharpe
- SQN
- drawdown
- average R
- losing streaks
- sample size
A 90% win rate can be excellent.
Or it can be a martingale time bomb.
The number alone tells you very little.
Can a profitable trading system have more losing days than winning days?
Yes.
Absolutely.
And ArcisTrade has already shown that in live tracking.
June had 11 losing days out of 19 trading days.
More red days than green.
Yet the month still finished positive.
Why?
Because number of winning days is not the same thing as expectancy.
Example:
11 losing days × -$100 = -$1,100
8 winning days × +$250 = +$2,000
Net:
+$900
More losing days.
Profitable month.
That’s why asking:
“How many days did it win?”
Can be much less useful than:
“What was the distribution of wins and losses?”
This week was another reminder.
Monday got hammered.
Ugly day.
That doesn’t automatically invalidate months of tracked performance.
The useful question is whether the behaviour is still within expected limits.
You can see the ArcisTrade data yourself.
The winners are there.
The losses are there.
The drawdowns are there.
Nothing hidden.
Why can a profitable trading strategy lose five times in a row?
Because trading is probabilistic.
Not deterministic.
A strategy can have a genuine edge and still produce ugly sequences.
That is normal.
A casino does not need every spin to win.
A trading system does not need every trade to win.
The edge exists across a large enough sample.
The ingredients are:
- positive expectancy
- correct sizing
- enough opportunities
- survival
That’s the game.
What does Monte Carlo simulation tell you?
A normal backtest gives you one historical sequence.
But the future won’t arrive in exactly that order.
Monte Carlo analysis reshuffles or resamples the same trade distribution many times.
Then you can ask:
- how long could the losing streak have been?
- how deep could drawdown reasonably get?
- how much sequence luck was in the backtest?
- what does a bad-but-plausible path look like?
That is much more useful than staring at one pretty equity curve.
Because the worst drawdown you have already seen is not automatically the worst drawdown you can ever experience.
Why position sizing matters during losing streaks
Suppose your testing suggests ten losses in a row are possible.
Trader A risks:
0.5% per trade
Ten losses:
roughly 5% before compounding effects.
Painful.
Still alive.
Trader B risks:
3% per trade
Now the same normal losing sequence becomes a major account event.
Same system.
Same edge.
Same trades.
Different survival odds.
This is why position sizing matters so much.
You cannot control whether the next trade wins.
You absolutely can control how much damage it does.
When should you stop trading a system?
Not after an arbitrary number of losses.
Pause or investigate when predefined evidence says the system may no longer be behaving as expected.
That could mean:
- drawdown materially exceeding tested expectations
- expectancy deteriorating over a meaningful sample
- Profit Factor collapsing
- execution costs changing
- regime changes
- live behaviour diverging from forward testing
- the structural edge disappearing
Notice what is not on the list.
“I had a bad week.”
That is not a risk rule.
That is an emotion.
The best time to decide when you will stop a system is before you are in drawdown.
This is where automation becomes powerful
Automation does not remove losing trades.
If somebody tells you it does, keep your wallet in your pocket.
What automation can remove is:
- hesitation
- revenge trades
- skipped setups
- emotional sizing
- boredom trades
- moving stops
- overriding rules after a bad run
Once the method is tested...
the risk is defined...
and the failure criteria are clear...
the system simply executes.
No mood.
No fear.
No:
“I don’t like this setup today.”
That is one of the biggest advantages of systematic trading.
Not removing losses.
Removing inconsistent execution.
Automation does not fix a bad system
Important point.
Automating rubbish does not make it good.
It just lets you execute rubbish 24 hours a day.
Fantastic.
The right order is:
- Understand the market.
- Find an edge.
- Test it.
- Stress test it.
- Understand the numbers.
- Define the risk.
- Then automate.
Not:
Download bot → attach to MT5 → pray.
The real difference between confidence and hope
Hope says:
“I’m sure it will recover.”
Confidence says:
“This drawdown is still inside the tested distribution.”
Big difference.
One is emotional.
The other is evidence-backed.
That is what I mean by mathematical confidence.
Losses still aren’t enjoyable.
But they stop feeling personal.
They become data.
If you don’t know these numbers, you are trading blind
Before I put serious capital behind a system, I want to know:
- Win rate
- Average winner
- Average loser
- Expectancy
- Profit Factor
- Maximum drawdown
- Monte Carlo drawdown
- Expected losing streak
- SQN
- Sharpe
If you don’t know those things...
but you know your RSI is set to 14...
your priorities might be slightly backwards.
Stop judging your trading system by this week
Five trades is tiny.
A week is tiny.
Sometimes even fifty trades is not enough.
What matters is whether live performance still fits the statistical characteristics you validated.
That’s why I like tracked live data.
Anyone can cherry-pick a good week.
The useful part is seeing:
- winning periods
- losing periods
- drawdowns
- recoveries
- strong months
- ugly months
together.
That is real trading.
The Bottom Line
A losing trade is an outcome.
A bad trade is a decision.
They are not the same thing.
A profitable trading system can have five losing trades in a row.
It can have more losing days than winning days.
It can lose while you execute perfectly.
The question is not:
“Did I lose?”
The question is:
“Is this still inside the distribution I tested?”
Know the expectancy.
Know the drawdown.
Know the losing streaks.
Size correctly.
Define failure rules in advance.
Then execute.
That is systematic trading.
See Real Automated Trading In Action
ArcisTrade tracks multiple automated trading systems across FX, gold and indices.
Winners and losers.
Good days and bad days.
Drawdowns and recoveries.
All together.
No grid.
No martingale.
No pretending losses do not exist.
See ArcisTrade in action →
Common questions
How many losing trades in a row is normal?
There is no universal number. The expected losing streak depends on win rate, sample size and trade distribution. A profitable system can experience several consecutive losses without its underlying edge having failed.
Does a losing streak mean my trading system is broken?
No. A losing streak can be normal statistical variance. A system should be investigated when live behaviour moves materially outside predefined expectations for drawdown, expectancy, Profit Factor, execution or market regime.
What is trading expectancy?
Trading expectancy estimates the average amount a strategy expects to make or lose per trade over a sufficiently large sample. It combines win rate, average winning trade, loss rate and average losing trade.
What is SQN in trading?
System Quality Number, developed by Van Tharp, is a system evaluation metric based on average R-multiple, variability of trade results and sample size.
Why is Monte Carlo simulation important in trading?
Monte Carlo analysis creates many alternative trade sequences from a strategy’s historical distribution. It helps estimate plausible losing streaks, drawdowns and sequence risk beyond the single path shown in a normal backtest.
Can a profitable trading system have more losing days than winning days?
Yes. Profitability depends on the size and distribution of wins and losses, not simply the number of winning days.
When should I stop trading a system?
A trading system should be paused or investigated when it breaches predefined failure criteria such as excessive drawdown, deteriorating expectancy, major execution changes or a structural change in the market behaviour the system relies on.
How does automated trading help during losing streaks?
Automated trading can execute predefined entry, exit and risk rules without revenge trading, hesitation, skipped setups or emotional changes to position size. It does not remove losing trades; it can reduce execution inconsistency.