How To Tell If Your Trading System Is Broken Or Just Having A Bad Month
Every trader eventually asks the same question — is this thing broken, or is this normal? Here are the four numbers that answer it, and the test that tells you when to stop.
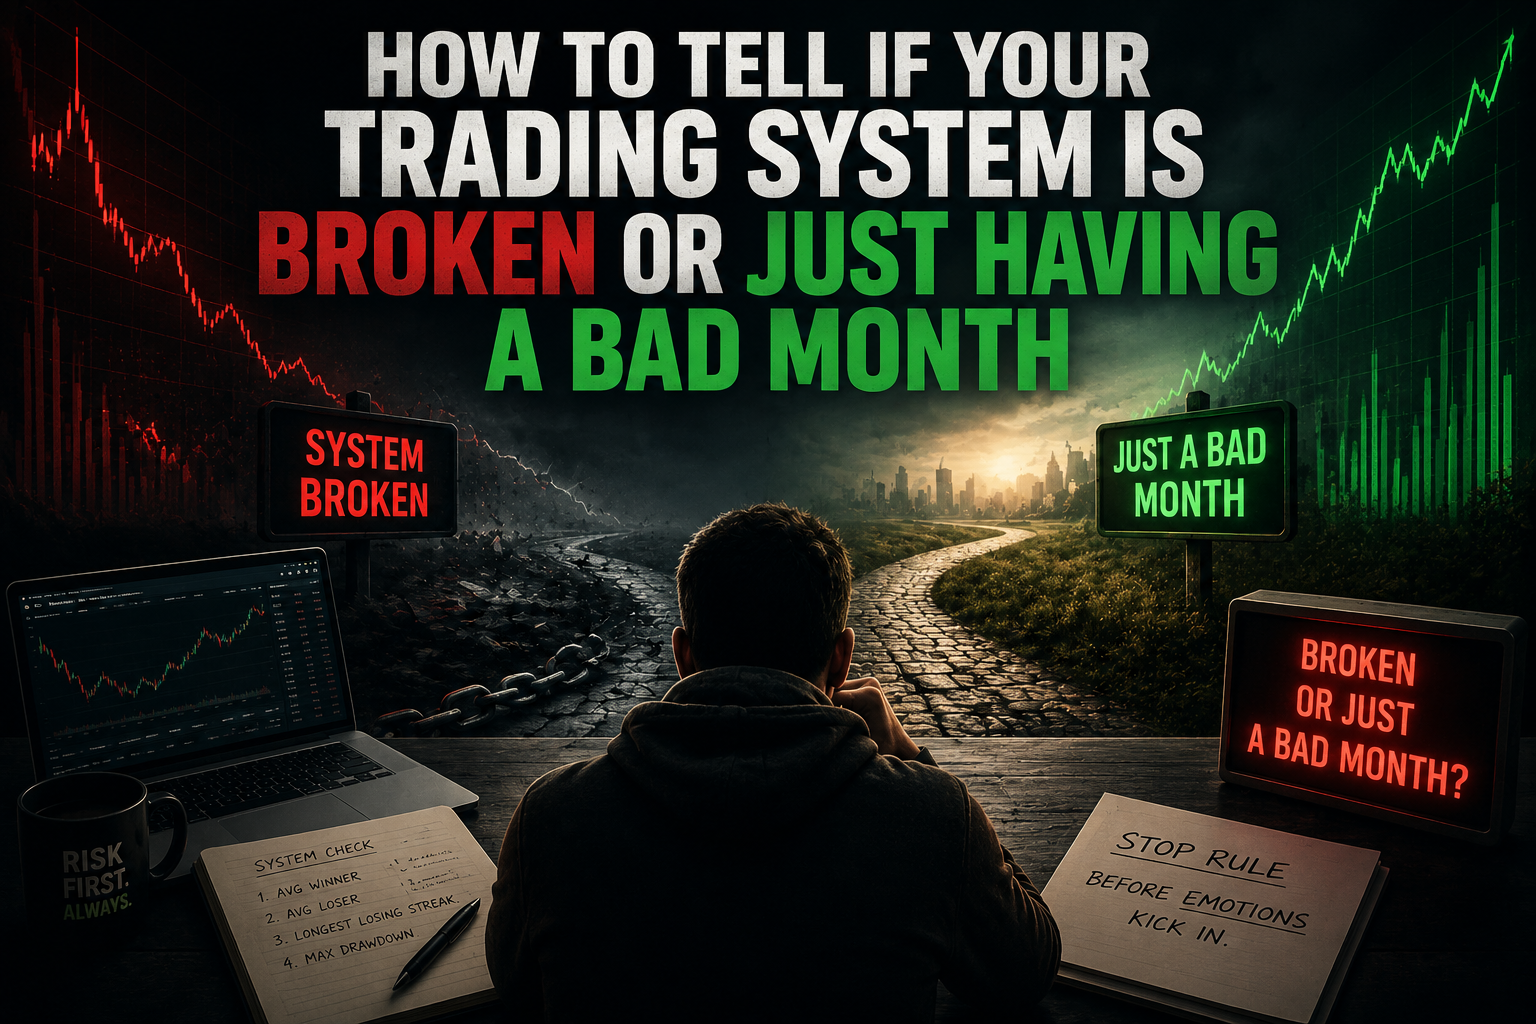
Usually about six weeks into something going wrong.
Is this thing broken? Or is this just what a bad patch looks like?
And here's the problem.
From the inside, those two feel absolutely identical.
Same drawdown. Same sick feeling. Same losing week followed by another one.
One of them means stop immediately.
The other means do absolutely nothing and wait.
Get it the wrong way round and you'll do what most people do.
You'll bin a perfectly good system three weeks before it recovers.
Then watch it recover without you.
I've done it. More than once. It's a horrible feeling and it's completely avoidable.
Here's how you tell the difference.
You can't answer the question without these four numbers
Before you can judge anything, you need to know what normal looks like.
Four numbers. That's all.
Most traders can't produce any of them, which is the actual problem.
1. Your average winner. In money, not pips.
2. Your average loser. Same.
3. Your longest losing streak. The most consecutive losses you've had.
4. Your worst peak-to-trough drawdown. How far down you went from a high point.
Have a go at those right now, on whatever you're trading.
If you can't answer them, you're not judging your system.
You're judging your mood.
I couldn't have told you mine for years. I could talk about my "approach" for an hour. Ask me my average loser and I'd have changed the subject.
Twenty minutes with your trade history fixes it.
What a normal losing streak actually looks like
This is where people panic without cause.
A system with a 50% win rate will produce a run of five losses fairly regularly.
Not as a disaster. As basic maths.
Flip a coin twenty times and you'll usually see a run of four or five one way.
Nobody says the coin's broken.
Here's a rough guide to what to expect over a few hundred trades:
Win rate Losing streak you should expect to see
70% 5–6 in a row
60% 7–8 in a row
50% 9–10 in a row
40% 12–14 in a row
Look at that 50% row.
Nine losses in a row, from a system that makes money over time.
Now be honest. Would you still be running it on loss seven?
Most people wouldn't. That's the entire problem.
Whatever your longest losing streak has been, assume the real one is worse.
You haven't traded long enough to have seen it yet.
So when is it actually broken?
Right. Here's the useful part.
A system is probably just having a bad month if:
- The drawdown is within what you've seen before
- The losing streak is within what the maths predicts
- The trades it's taking still look like its normal trades
- Nothing has changed about how you're running it
A system is probably broken if:
The drawdown has gone beyond anything in its history. Not "the worst this year."
The worst ever, including the backtest.
The character of the trades has changed. It's trading twice as often, or holding far longer, or entering in conditions it used to avoid.
The market structure it relies on has genuinely gone.
A system built on a volatility regime that no longer exists is not having a bad month.
The losses are getting bigger rather than more frequent. That's the dangerous one.
More frequent losses is variance. Bigger losses is a risk control that's stopped working.
That last point matters more than the rest.
Frequency changes are noise.
Size changes are a fault.
The test to set before you need it
Here's the bit nobody does, and it's the only bit that reliably works.
You decide when to stop before you start.
Not during. Not while you're down. During is when you're least capable of judging anything.
So write it down in advance:
"I stop this system if drawdown exceeds X%, or if it loses more than Y times in a row, or if it's still below its previous high after Z months."
Three numbers. Written before you're emotional about them.
Then when the bad patch comes — and it will — you don't have to make a decision.
You already made it, back when you could think straight.
Pick your numbers from the system's own history. Roughly 1.5x its worst historical drawdown is a sensible starting point, because the worst is always ahead of you, not behind.
Why this is easier with automation (and harder than people admit)
Automation helps here for one reason only.
It gives you the numbers.
Every trade logged. Every drawdown recorded. Every losing streak visible whether you like it or not.
You can't fool yourself about your average loser when it's on a screen in front of you.
But — and this is the bit sellers skip — automation makes the emotional problem worse, not better.
Because now you're watching a machine lose your money and you can't intervene.
That's a specific kind of horrible.
And it's precisely why the stop rule has to be written before you switch anything on.
A system that shows you its bad weeks is doing you a favour, not embarrassing itself.
If you can only see the good weeks, you have no way of knowing what normal is.
Which means you can never answer the question at the top of this article.
The short version
Get your four numbers. Average winner, average loser, longest losing streak, worst drawdown.
Learn what a normal losing streak looks like for your win rate. It's longer than you think.
Bigger losses is a fault. More frequent losses is usually variance.
Write your stop rule before you need it, not during.
If you can't see a system's losing trades, you can't judge it at all.
That last one is worth sitting with.
Most of what's sold to retail traders shows you the winners.
Which means you're being handed a system you have no way of evaluating.
Every trade on ARCIS is visible, open to close — the losing ones sat beside the winners, and the systems still in testing shown alongside the live ones.
Watch it for 14 days, free, no card.
P.S. Do the four numbers today, even if you never read another word from me. It's twenty minutes and it changes how you look at every trade you take afterwards.