How to Build an Automated Trading System That Lasts
Most trading bots start with an entry and hope the market keeps behaving the same way. Robust automated systems are built differently: measure behaviour, form a hypothesis, test it, define risk, validate it and automate only when the evidence survives.
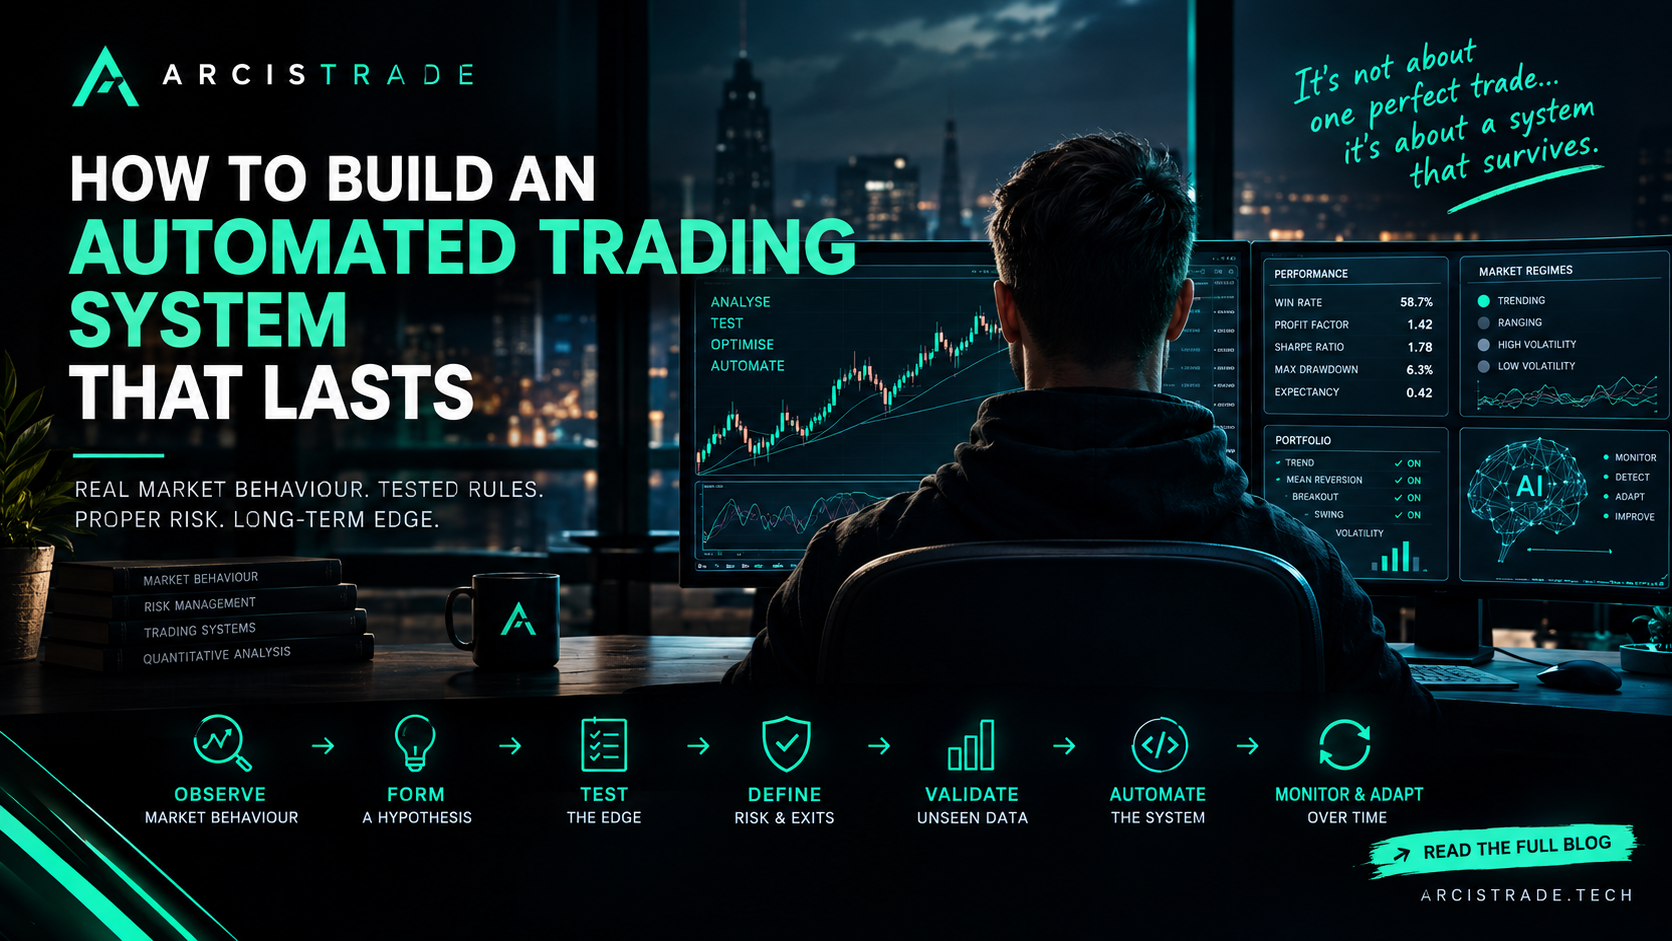
Most trading bots start with an entry signal, run a backtest and then get automated.
When performance deteriorates, another indicator gets added. Then another filter.
Then grid. Then martingale. Eventually the “system” needs more rescue logic than actual trading logic.
Robust systematic trading works differently.
You start by measuring how a market behaves, develop a hypothesis around that behaviour, test whether an edge actually exists, define the risk and exits, attack the model, validate it on unseen data — and only then automate it.
What nearly everyone does is try and find an entry that looks clever.
Maybe it’s an RSI level.
Maybe it’s an FVG.
Maybe two moving averages cross while Mercury is in retrograde and a bloke on YouTube says, “This one is VERY high probability.”
They backtest it.
The equity curve goes up.
Champagne.
Then the market changes.
The system starts losing.
So naturally, instead of asking whether the original idea had any real edge, we add:
Grid.
Martingale.
Recovery mode.
Averaging down.
Six filters.
Three emergency filters for the original six filters.
And eventually an input called something like:
MAXIMUM_RECOVERY_MULTIPLIER = 8
At this point we haven’t built a trading system.
We’ve built a hostage negotiation.
A robust automated system starts somewhere completely different.
It starts with the market itself.
Stop looking for entries. Start looking for behaviour.
Before asking:
“When should I buy?”
Ask:
“What does this market repeatedly do?”
That sounds almost offensively obvious.
Yet retail trading education generally does the opposite.
Open chart.
Add indicator.
Find setup.
Give setup a dramatic name.
Sell course.
Real system development works backwards from observable behaviour.
Pick an asset.
Then study it.
Not for twenty candles.
Not because yesterday looked “bullish.”
Over meaningful samples and different environments.
You want to understand things like:
- How far does it normally move in a day?
- How far does it travel from the open before returning?
- What does its open-to-close distribution look like?
- How does its volatility change between sessions?
- How often does it trend?
- How often does it range?
- How far does it typically stretch from a behavioural mean?
- What happens after unusually large moves?
- Does volatility cluster?
- What changes when the market enters a genuinely directional regime?
Now you’re doing research.
EURUSD and Gold are not the same animal
This matters because traders constantly try to force the same setup onto completely different markets.
EURUSD is one of the most liquid markets in the world.
Over long samples, its signed open-to-close daily distribution tends to cluster tightly around zero.
That does not mean EURUSD doesn’t move.
It can travel 40, 50, 60 pips intraday and still finish relatively close to where the day began.
That tells us something interesting.
Not:
“EURUSD always mean reverts.”
But:
Large intraday displacement does not automatically equal permanent directional movement.
That gives us something worth investigating.
Gold is completely different.
Gold can expand violently.
It can move tens of dollars very quickly, respond aggressively to macro events and transition from quiet to chaos before you’ve finished making coffee.
So a Gold system may need completely different:
- thresholds
- stops
- holding periods
- volatility filters
- entry logic
- exit logic
Same planet.
Different species.
Now turn behaviour into a hypothesis
This is where a trading idea becomes something useful.
A retail trader says:
“Gold looks oversold.”
A system developer says:
“When Gold moves an unusually large volatility-adjusted distance from its recent behavioural mean during a non-trending regime, does subsequent price action show a statistically meaningful tendency to revert?”
One is an opinion.
The other can be tested.
Same with EURUSD.
Instead of:
“Buy Pivot 2.”
Ask:
When EURUSD reaches an extreme distance from the daily open, how frequently does price subsequently revert toward the open before extending further?
Then start conditioning it.
Does the result change depending on:
- ADR?
- London vs New York?
- time of day?
- current volatility percentile?
- Pivot 1 vs Pivot 2?
- trend strength?
- distance from a 20/50/100-period mean?
- day of week?
- recent volatility expansion?
Now we’re getting somewhere.
The entry is not the edge
This distinction matters enormously.
Once you identify a behaviour worth testing, then you experiment with ways of entering it.
Maybe you test:
- momentum deceleration
- a short-term moving-average crossover
- rejection beyond a pivot
- price returning inside a volatility band
- reversal structure
- momentum divergence
- a simple price-based trigger
None of those things need to be magical.
They have one job:
Trigger participation in a behaviour you already have reason to believe exists.
That is completely different from throwing indicators onto a chart until the backtest stops looking embarrassing.
The behaviour is the hypothesis.
The entry is just the door.
Make the system understand when the market changes
Here’s another reason fixed retail systems die.
They assume tomorrow’s market will have roughly the same characteristics as yesterday’s.
It won’t.
Volatility expands.
Volatility contracts.
Trends appear.
Ranges disappear.
Correlations shift.
Sessions behave differently.
So instead of saying:
“Enter whenever price is 30 pips away from the mean.”
You might define the threshold relative to current average daily range or another volatility measure.
When volatility increases:
- entry distance can widen
- stops can widen proportionally
- targets can adjust
- position size can reduce
- trade frequency can change
- a mean-reversion system can stand aside entirely during a strong trend
Now the system isn’t blindly repeating yesterday’s conditions.
It’s responding to the environment it actually finds itself in.
That is what adaptive system design means.
Not:
“AI changed my stop because vibes.”
Your exit deserves more research than your entry
Entries get all the attention because entries are sexy.
Nobody sells a £2,000 course called:
Advanced Maximum Holding Period Techniques.
But your exit determines what you actually capture.
For a mean-reversion hypothesis, you might test:
- full return to the daily open
- return to a moving mean
- 50%, 70% or 100% recovery of the original excursion
- fixed reward-to-risk
- volatility-adjusted targets
- time-based exits
- momentum reversal
- maximum holding period
- early exit when the original hypothesis is invalidated
Then compare them.
Maybe the market regularly gives you 60% of the reversion but only occasionally gives you 100%.
Demanding the full move could actually make the system worse.
The data decides.
Not your desire to squeeze another 12 pips out of it.
Then try to destroy it
This is the part people skip because it’s far less enjoyable than looking at an equity curve going vertically upward.
Once we have something promising, the next question is:
How quickly can we prove it’s rubbish?
Change the parameters.
Increase spreads.
Add slippage.
Delay execution.
Test different years.
Test high volatility.
Test low volatility.
Test trends.
Test ranges.
Use unseen data.
Walk it forward.
Run Monte Carlo simulations.
Check neighbouring parameter values.
If:
1.8 = fantastic
but
1.9 = disaster
and
1.7 = disaster
you probably haven’t discovered the secret mathematical heartbeat of the financial markets.
You’ve probably curve-fitted noise.
A strong system generally lives in a region of acceptable parameters, not on one magical number.
And please stop rescuing bad systems with martingale
A strategy starts losing.
So size gets increased.
Then increased again.
Then again.
Now the strategy appears to “recover.”
Until it meets the market sequence it cannot recover from.
Grid and martingale can make equity curves look beautifully smooth for long periods because losses are being deferred and exposure is expanding.
That is not the same thing as creating an edge.
If the underlying hypothesis requires continuously increasing risk to survive, the risk model is doing the heavy lifting.
Not the strategy.
You should be able to explain why the system makes money before discussing clever ways of rescuing losing trades.
Trading Automation should be almost boring
By the time we automate, virtually every important decision should already exist.
The finished system knows:
Market behaviour
↓
Regime
↓
Entry condition
↓
Position size
↓
Stop
↓
Target
↓
Exit
↓
Risk limits
↓
Kill switch
Then the software simply executes.
No Monday morning pep talk.
No:
“This one feels good.”
No moving the stop because the last candle looked scary.
No doubling the position because you’re annoyed.
No opening YouTube halfway through a drawdown to find someone who agrees with you.
That’s the beauty of automation.
It doesn’t make a bad system good.
It makes a defined system consistent.
Then AI becomes genuinely useful
This is where the current AI mania gets backwards too.
Retail traders are trying to teach AI to stare at charts like retail traders.
Wonderful.
We’ve invented a machine capable of processing enormous amounts of information at ridiculous speed...
…and asked it to find an FVG.
AI becomes much more interesting after you have a systematic framework.
It can help monitor:
- rolling expectancy
- current versus historical volatility
- regime changes
- performance degradation
- changing correlations
- abnormal drawdowns
- system rankings
- portfolio allocation
- whether current behaviour still resembles the behaviour the system was designed around
In other words:
AI doesn’t need to predict the next candle.
It can help answer a far more valuable question:
Is the edge we originally measured still behaving the way we expect?
That’s intelligence.
One Trading system still isn’t enough
Even a genuinely good system will eventually meet an environment it hates.
A trend system gets chopped apart in a range.
A range system meets a runaway trend.
A breakout system spends a month buying false starts.
A mean-reversion strategy encounters the move that simply refuses to revert.
That doesn’t necessarily mean anything is broken.
It means edges are conditional.
Which is why the natural progression is:
One system → multiple independent systems → portfolio.
Trend.
Mean reversion.
Swing.
Breakout.
Volatility.
Different assets.
Different horizons.
Different market regimes.
Now you’re no longer asking one strategy to perform every job.
You’re building a business around multiple sources of expectancy.
The whole thing in one sentence
A durable automated trading system is not:
Indicator → entry → backtest → bot.
It is:
Observe behaviour → form hypothesis → test it → define rules → design risk → design exits → attack the model → validate unseen data → automate → monitor → adapt.
That’s system development.
It isn’t as sexy as:
“SECRET 97% WIN-RATE GOLD BOT.
But it has one enormous advantage.
You might actually understand why the bloody thing trades.
And that matters.
Because when the inevitable drawdown arrives, there are only two kinds of traders.
The first opens YouTube and searches:
“Is my strategy broken?”
The second opens the data.
That’s the difference.
Want to See What This Looks Like in Practice?
Building one robust trading system takes research, testing, forward validation and ongoing monitoring.
Building a portfolio of them takes considerably more.
That’s what ArcisTrade is built around.
Instead of relying on one strategy, one market regime or one trader making decisions in real time, ArcisTrade gives you access to multiple automated trading systems designed to operate across different market conditions.
You can monitor the systems, follow their tracked performance and see systematic portfolio automation working for yourself.
Explore the platform, switch systems on in demo mode and see how a systematic trading portfolio behaves before deciding whether it’s for you.
No martingale. No grid. No magic “AI predicts the market” nonsense.
Just rules, automation, tracked performance and multiple systems doing different jobs.
Start Your 14-Day ArcisTrade Demo →
Common questions
What is an automated trading system?
An automated trading system is a defined set of trading rules that software can execute without requiring a trader to make each decision manually. A complete system should define its market conditions, entries, position sizing, risk, exits and circumstances in which it should not trade.
How do you build an automated trading system?
Start by identifying measurable market behaviour, form a testable hypothesis, define objective trading rules, backtest the idea, test it on unseen data, stress test the model, forward test it under realistic conditions and automate it only after the strategy has survived validation.
Are automated trading systems profitable?
Automation itself does not create profitability. It simply executes predefined rules consistently. Whether a system has positive expectancy depends on the underlying trading edge, costs, risk management and whether the behaviour it exploits persists in live markets.
Why do trading bots stop working?
Market behaviour changes. Volatility, correlations, liquidity and market regimes are not constant. Systems built around overly specific historical conditions can deteriorate when those conditions change, which is why robustness testing and ongoing monitoring matter.
Is martingale a good automated trading strategy?
Martingale changes the position-sizing structure rather than creating a trading edge. Increasing exposure after losses can produce smooth historical results for long periods while concentrating severe tail risk when an extended losing sequence eventually occurs.
Can AI build an automated trading system?
AI can assist with research, regime detection, monitoring, feature analysis, system ranking and identifying performance degradation. But AI still requires reliable data, objective goals and robust validation. It does not remove the need for a measurable underlying edge.
What is the difference between algorithmic trading and automated trading?
Algorithmic trading uses predefined computational rules to make or assist trading decisions. Automated trading goes further by allowing software to execute those decisions without requiring manual intervention. Many modern trading systems are both algorithmic and automated.