What Is Trading Expectancy (And Why Your Win Rate Is Lying To You)?
Win rate feels comforting. Expectancy tells the truth. Here’s the maths, the traps, and what automation actually changes.
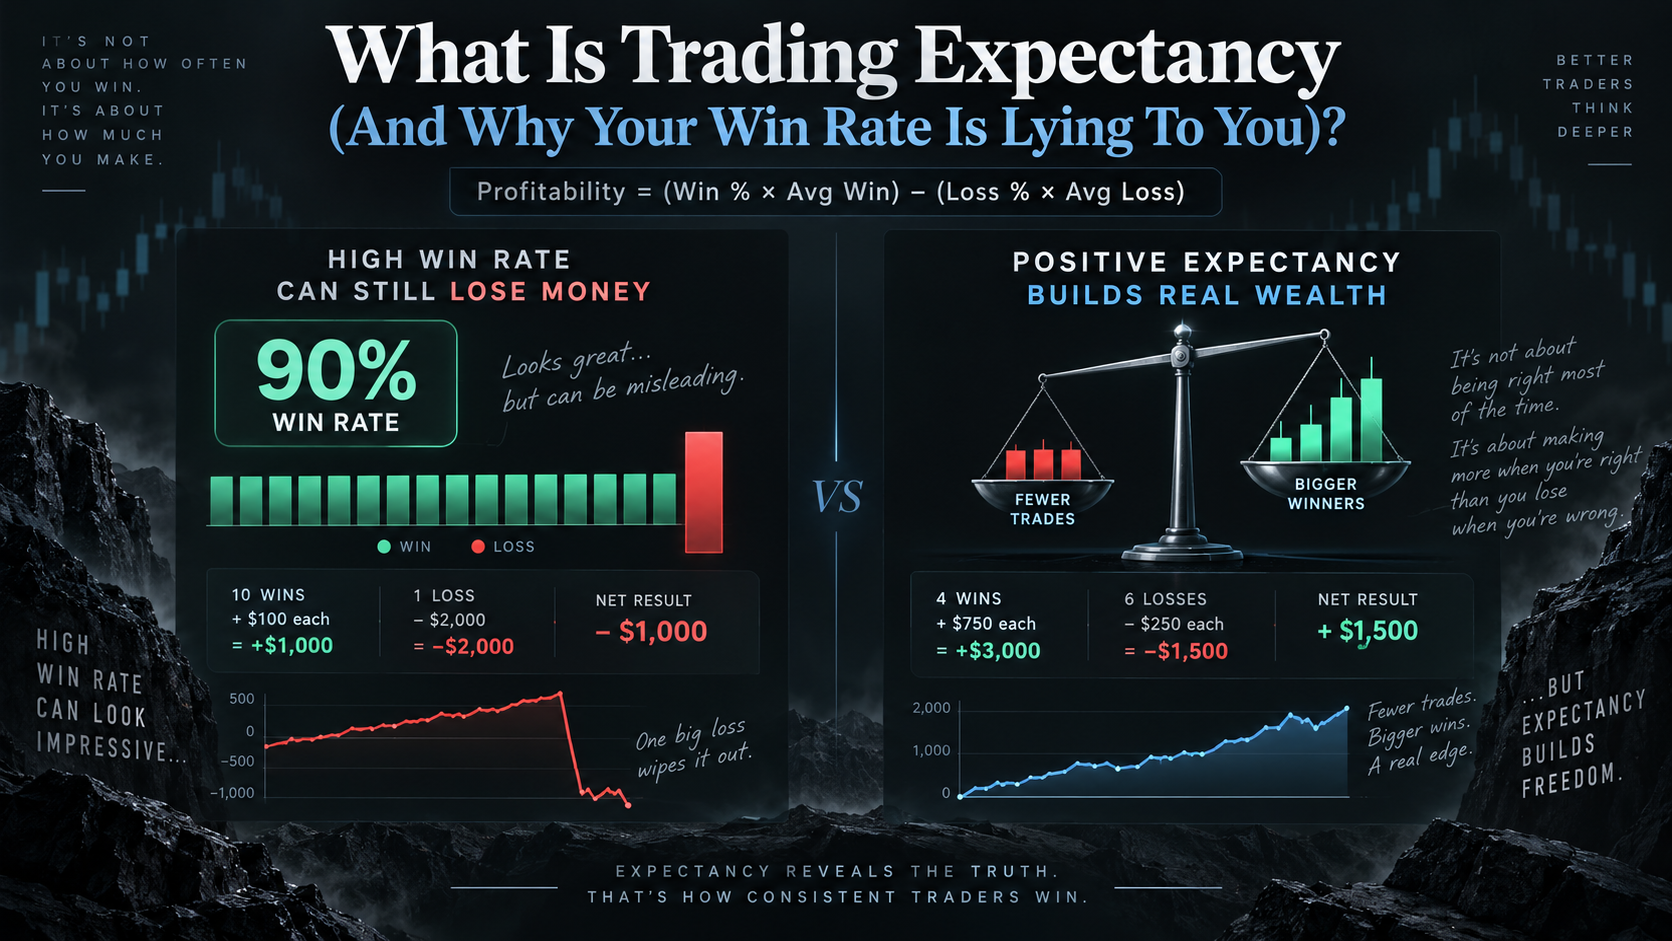
You already know the question traders actually ask, they just rarely say it out loud.
"Does this thing make money, on average, every time it pulls the trigger?"
That question has a precise answer.
It’s called trading expectancy.
What is trading expectancy, in plain English?
Forget the jargon for a second.
Trading expectancy is the average result per trade over a lot of trades, usually measured in R.
R is just your risk per trade. Risk £100, that’s 1R. Win £200, that’s +2R. Lose £50 because you cut early, that’s -0.5R.
Expectancy then is, "If I run this system for hundreds of trades, what is the average R I win or lose each time it fires?"
If the answer is +0.3R, you have a positive system. If it’s -0.1R, the system is quietly bleeding you while the win rate keeps you entertained.
Why the win rate fools you
You already know the textbook trap.
Strategy A wins 80% of the time but only makes 0.5R per winner and loses 3R on a loser.
Strategy B wins 35% of the time, makes 3R on winners and loses 1R on losers.
Everyone who hasn’t done the maths wants Strategy A.
Everyone who has done the maths is slightly offended by it.
The trading expectancy formula (this is the whole point)
The general trading expectancy formula, using R, is:
Expectancy per trade (in R) = (Win rate × Average win in R) − (Loss rate × Average loss in R)
Loss rate is just 1 − win rate.
Take the two strategies.
| Strategy | Win rate | Avg win | Avg loss | Expectancy |
|---|---|---|---|---|
| A | 80% | +0.5R | −3R | (0.8×0.5) − (0.2×3) = 0.4 − 0.6 = −0.2R |
| B | 35% | +3R | −1R | (0.35×3) − (0.65×1) = 1.05 − 0.65 = +0.4R |
Strategy A feels lovely.
It also loses 0.2R per trade on average.
Strategy B feels like a constant stream of pain, but gains 0.4R per trade on average.
That’s trading expectancy in action: it combines win rate and risk-reward ratio into one number that actually means something.
Risk-reward ratio: the part everyone leaves out
Win rate is easy to brag about.
Risk-reward ratio is where the grown-ups live.
Take a system with 50% win rate. Sounds average. If the average win is 2R and the average loss is 1R, expectancy is:
(0.5×2R) − (0.5×1R) = 1R − 0.5R = +0.5R per trade.
Same 50% win rate but with 0.8R average wins and 1R average losses gives:
(0.5×0.8R) − (0.5×1R) = 0.4R − 0.5R = −0.1R per trade.
Same win rate. Very different future.
If you want a second metric that plays nicely with expectancy, look at profit factor too — it tells you how much gross profit you make for every unit of gross loss, and we covered that in detail here: /blog/what-is-profit-factor-and-what-counts-as-good.
Why expectancy belongs in R, not in pounds
You’ll see traders quote expectancy in cash.
"My system makes £15 a trade on average."
That’s meaningless unless you know the risk per trade, the account size, and whether the trader is permanently over-positioned.
Expectancy in R strips all that out.
If expectancy is +0.3R per trade, that applies whether you risk £10 a trade or £10,000.
Change the account size, change the position size, the expectancy in R should not budge unless you change the system.
This is also why expectancy is a better anchor for long-term system performance than staring at the equity curve and guessing if it’s "ok".
Expectancy and sample size: you can’t cheat the maths
Here’s where it gets uncomfortable.
Your backtest shows an expectancy of +0.5R over 40 trades.
That number is basically a rumour.
Any estimate of trading expectancy is only as good as the number of trades you’ve used to estimate it.
Systems with a low win rate and high risk-reward ratio, like long-term trend followers, might need hundreds of trades before you have a remotely stable view of the average.
There’s a reason we wrote a whole piece on how many trades you need for testing: /blog/how-many-trades-do-you-need-to-test-a-strategy.
Short version: you need more trades than your brain wants, and probably more than your computer fan wants as well.
Expectancy doesn’t cancel drawdowns
Positive expectancy is necessary.
It is not sufficient for your sanity.
A system with +0.4R expectancy can still have brutal drawdowns and long losing streaks, depending on the win rate and distribution of returns.
If you want to know how bad a losing streak can get, you look at win rate and number of trades, not just expectancy.
We’ve gone into losing streak maths here: /blog/how-many-losing-trades-in-a-row-is-normal.
The key point is simple: expectancy tells you the average direction of travel, not how bumpy the road is.
Position sizing then decides whether those bumps blow your account up or just bruise your ego.
Risk line, stated plainly: you can lose money trading even with a positive expectancy system, especially if you size too large or ignore drawdown risk.
How to calculate expectancy from your own trades
Enough theory.
Take a spreadsheet or log from a live or demo account and do this:
- Decide your 1R for each trade (your planned risk if the stop is hit).
- Convert every trade result into R: profit divided by that trade’s 1R, loss divided by 1R.
- Count total trades, total winners, total losers.
- Calculate win rate = winners ÷ total trades.
- Find average win in R (sum of Rs on winning trades ÷ number of winners).
- Find average loss in R (absolute value) (sum of |R| on losing trades ÷ number of losers).
- Plug into the trading expectancy formula.
If this is a discretionary approach, expect the number to move around over time.
If it’s a fixed ruleset or an automated trading system, the estimate should stabilise as the trade count grows.
The moment you start tweaking rules every dozen trades, your historical expectancy becomes a museum exhibit.
Expectancy, automated trading, and what actually changes
Automation doesn’t make expectancy better.
It just makes it more honest.
An automated trading bot will execute every signal, good or bad, without skipping the ones that "feel wrong today".
So the expectancy you estimated in your backtest, if the test was done properly and not overfitted, has a fighting chance of matching what happens in the live account.
That’s one of the reasons systematic or automated trading tends to produce cleaner expectancy estimates than human discretionary trading: the rules are consistent, so the distribution is at least stable in theory.
The trade-off is simple: the bot won’t protect you from bad systems.
If the system has negative expectancy, automation will just lose efficiently.
Why martingale and grid fake a nice expectancy
Some strategies look like they have fantastic trading expectancy.
They also have one small detail: occasional account death.
Classic martingale and grid structures often show high win rates, small average wins, and then rare but massive losses.
If you look at a short backtest window, the losses might not show up at all, so the estimated expectancy looks spectacular.
When the cluster of losses finally appears, the expectancy collapses in one evening, as does the account.
This is where expectancy on its own can lie to you.
You need to think about tail risk and structural exposure, not just the neat average.
We’ve covered why these tactics tend to blow up over time here: /blog/why-martingale-grid-bots-fail.
Different markets, same expectancy maths
Whether you’re looking at forex trading expectancy, equity indices, or gold, the formula is the same.
The only difference is how violent 1R feels on your equity curve.
Forex pairs can be relatively smooth at small position sizes; a 1R risk might be a few pips on EURUSD, barely visible on a sensible account size.
Run the same nominal risk on XAUUSD and that "small" 1R can be loud, especially if your minimum position size is 0.01 lots on a small balance.
The expectancy in R might be identical between a calm FX system and a choppy gold system, but the experience is not.
Same average gain per trade. Very different path to get there, and very different chance of you bailing out early.
Expectancy and risk per trade: how the money actually shows up
Once you know your system’s trading expectancy in R, you can translate it into money, with all the usual caveats.
Expected gain per trade in cash is:
Expected cash per trade = Expectancy in R × Risk per trade (in cash)
If expectancy is +0.3R and you risk £100 per trade, then the long-run average is +£30 per trade.
That does not mean the next trade "should" win £30.
It means that over hundreds of trades, you would expect the average to be £30, assuming the system stays the same and the market doesn’t change character too much.
This is where traders start playing with risk of ruin calculators, because you can also ask, "At this position size and this expectancy, what is the chance I blow up before the edge plays out?"
There’s no magic number, but you quickly see why risking 5–10% per trade is less "aggressive" and more "statistical self-harm".
Overfitting, fake expectancy, and why you must be boring
There’s an ugly way to get a high expectancy on paper.
Curve-fit the strategy to your historical data until the backtest looks like a staircase.
You can easily produce a backtest with +1R expectancy or more per trade by over-optimising entries, exits, and filters on past data.
Then reality happens.
The out-of-sample expectancy collapses because the system wasn’t capturing a structural edge; it was memorising noise.
If you’re building your own automated trading system, you need to design and test in a way that resists this temptation; we unpack that here: /blog/what-is-overfitting-in-trading-and-how-to-spot-it and also in /blog/blog-how-to-build-an-automated-trading-system-that-lasts.
The very short version: a slightly lower but stable expectancy in live trading is worth more than a heroic backtest that only works in screenshots.
How expectancy helps real decisions
So what do you actually do with trading expectancy once you’ve got it?
- Filter systems: A system with negative expectancy is gone, regardless of how "nice" the win rate looks.
- Compare approaches: Two strategies with similar volatility but different expectancies? You know where your capital belongs.
- Size risk: Higher expectancy allows smaller position sizes to reach the same long-run goals, which lowers stress and drawdown.
- Stay the course: If you know your system has +0.4R expectancy and you’re in a drawdown that is statistically normal, you’re less likely to pull the plug at the worst possible moment.
Most traders fire systems on feeling, not on whether the measured expectancy has genuinely broken down.
We talk about that calendar-driven sabotage here: /blog/why-most-traders-switch-off-profitable-systems-the-calendar-problem.
Expectancy gives you at least one anchor that isn’t your mood.
Where to go from here
If you take one thing from this, let it be this:
Win rate is the costume. Expectancy is the person wearing it.
Calculate your system’s trading expectancy in R. Then look at drawdown, streaks, and position sizing around that number.
If you’re using automation or thinking about it, treat the code as an execution engine, not a magic edge generator. The maths still has to work.
And if a strategy’s pitch starts and ends with win rate, you already know what to ask next.
Start your free 14-day ArcisTrade demo →
P.S. Watch multiple automated systems side by side, see the winners and the losers, and do your own expectancy maths before you trust anything with real money.
Common questions
What is a good trading expectancy?
There is no universal "good" trading expectancy, because it depends on your style, timeframe, and risk tolerance. As a rule of thumb, many systematic traders are happy with anything consistently positive after costs, for example +0.2R to +0.5R per trade, provided drawdowns and losing streaks are survivable and the edge looks robust rather than overfitted.
How do you calculate trading expectancy?
Convert each trade into R (result divided by that trade’s risk). Then find win rate, average win in R, and average loss in R. Plug them into: Expectancy = (Win rate × Average win) − (Loss rate × Average loss). Use a large sample size for a more reliable estimate, ideally hundreds of trades for systematic strategies.
Can you have a high win rate but negative expectancy?
Yes. A strategy that wins very often but has much larger losses when it does lose can have negative expectancy. For example, an 85% win rate with average wins of +0.5R and average losses of −4R gives an expectancy of (0.85×0.5) − (0.15×4) = 0.425 − 0.6 = −0.175R per trade. It feels good most days but loses over time.
Does automated trading improve expectancy?
Automation does not create an edge by itself, so it doesn’t improve expectancy magically. What it can do is execute your rules consistently, so the expectancy you measured in testing has a better chance of matching live results. If the underlying system has negative expectancy, automation will simply apply that losing edge more consistently.